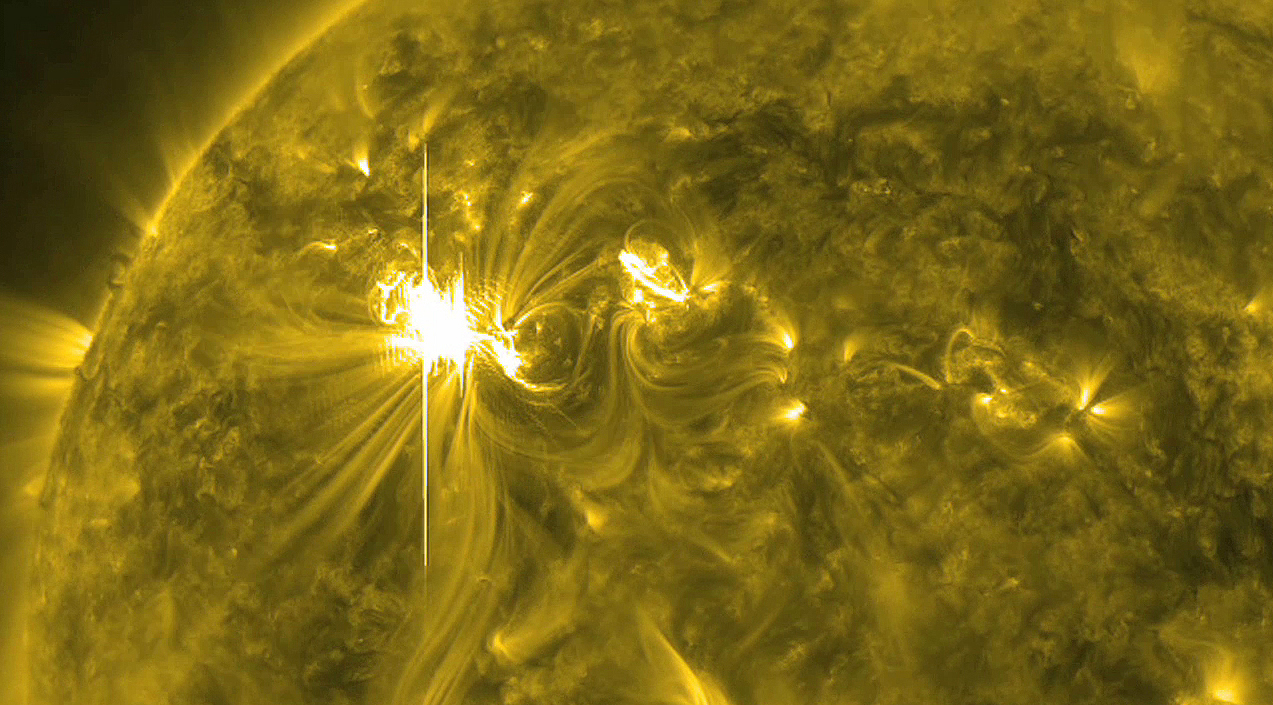
Friday, March 9, 2012

Space Weather

CME March 7th, 2012

The sun has been very active lately! It's reaching the peak of its 11 year sunspot cycle, and therefore solar storms and flares are more prominent. You probably heard about the giant solar flare that smacked into Earth early yesterday from your favorite news channel, but there are many places on the web where you can get information that's a bit more detailed than what your news anchor says. One of my favorite places to visit is SpaceWeather.com. Here you can find all sorts of information about the sun, solar storms, solar flares and other space weather related things. It also shows you a daily picture of the sun in case you are looking to view sunspots. There's information about the speed of the solar wind and any types of flares that are headed our way. Today, the solar wind is hitting us at 296 km/s (that's 662,000 miles per hour!) You can also check the site to see when objects such as the international space station will be visible in the night sky.
 

Tuesday, March 6, 2012

Measuring Temperature with Light

If you have ever read a news article or scientific paper on a star or group of stars, the author may have given a temperature for that star. But how do they know how hot the star is? There are many methods that astronomers use to estimate the temperature or all sorts of objects, but the simplest way is just to look at light! 

  
Astronomers assume that objects such as stars, planets, etc. in space emit like blackbodies. A blackbody is an object that emits a majority of light over one small wavelength range that directly corresponds to its temperature. Let's take the sun as an example. The image above is a blackbody curve for our sun, where the vertical axis is amount of light emitted and the horizontal is the wavelength or color of light. This graph says that the sun emits most of its light around ~0.5um (yellow) and not much at other colors. Emitting mostly at yellow means you have a temperature of ~5800 Kelvin. If you emit most of your light at shorter wavelengths, then you are hotter. If you emit more light at longer wavelengths then you are colder. Graphs like this can be made for any object just by observing it through different filters with a telescope. This method works best for objects that emit light in the UV, optical, and Infrared, and with one simple equation astronomers can calculate the temperature of an object based solely on its color. We can't always use this method measure the temperature of objects that emit in the x-ray or radio, because this light is usually not caused by heat, but by other mechanisms.

Humans emit most of their light in the infrared, which is why we glow fun colors in pictures taken with infrared cameras. Based on this fact, we can figure out that humans have a temperature of ~310 kelvin, or 98F. So this method works both on Earth and in space!

Image Credit: Quantumfreak.com